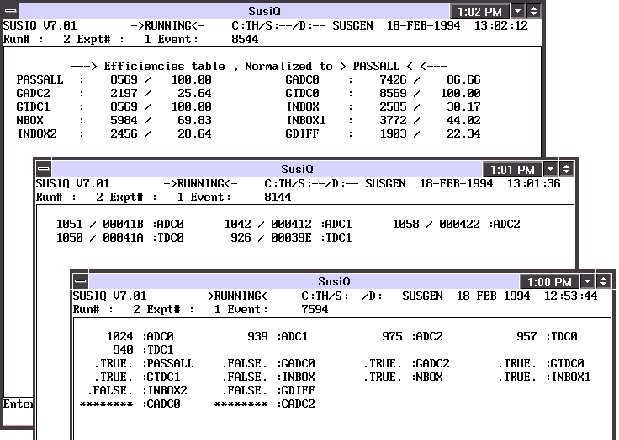
Main command for displaying live results. This key is the most used during acquisition. It allows you to display histograms, efficiencies, raw data, computed data, and dotplots online. This means that you still acquire data while you browse through the different display options. The EFficiency table gives you statistics on test conditions with a ratio relative to a predefined normaliszation condition test. The PRevent table contains all the raw data values displayed in decimal and hexadecimal format. The PEeper table gives you the raw data similar to PRevent but in addition you get the computed quantities and the conditional test results on a event by event basis.
| EFficencies | update_frq | normalization test | |
| HIstogram | histo name/# | update_frq | |
| PRevent | update_frq | ||
| PEeper | update_frq | ||
| DOtplot |
* : dotplot listing -# : remove dotplot # # : display dotplot # X_var : new dotplot followed by: X_low,X_high,Y_var,Ylow,Y_high,test name |
update_frq | projection mode |
| STatus | update_frq |